Overview01
How far has BART ridership come back, where is it heading next week, did the newest extension bring new riders, and which stations can the system least afford to close? BayRidership answers all four from one warehouse, and lets anyone ask their own question in plain English.
Public BART and Bay Wheels data lands in BigQuery through a Dagster pipeline that runs itself on a free Oracle VM. PySpark cleans the raw trip files, dbt models them into a star schema with 84 data tests, and a LightGBM model forecasts every station two weeks out. A FastAPI service on Cloud Run serves the numbers and a LangGraph text-to-SQL agent to a hand-built site that is live on this domain. The whole thing runs at $0, inside every service's free tier.
- 01
Built a scheduled Dagster pipeline (PySpark + dbt on BigQuery) over 67.8M BART trip rows and 26.0M Bay Wheels trips: an SCD2 station dimension, partitioned and clustered facts, 17 dbt models and 84 data tests, with one definition per KPI feeding the site and the agent.
- 02
Forecast daily entries at all 50 stations 14 days ahead with global LightGBM quantile models, cutting MAE 48% against a seasonal-naive baseline (283 vs 549) under walk-forward validation with bootstrap CIs, and calibrated the band with split-conformal prediction; it covers 73% of back-test days against an 80% target.
- 03
Shipped a guarded text-to-SQL agent (sqlglot AST checks, a read-only service account, BigQuery dry runs, byte budgets) and tested its retrieval step in a pre-registered A/B test with a power analysis: execution accuracy 27% → 50% on 66 gold-SQL questions, exact McNemar p = 0.004.
- 04
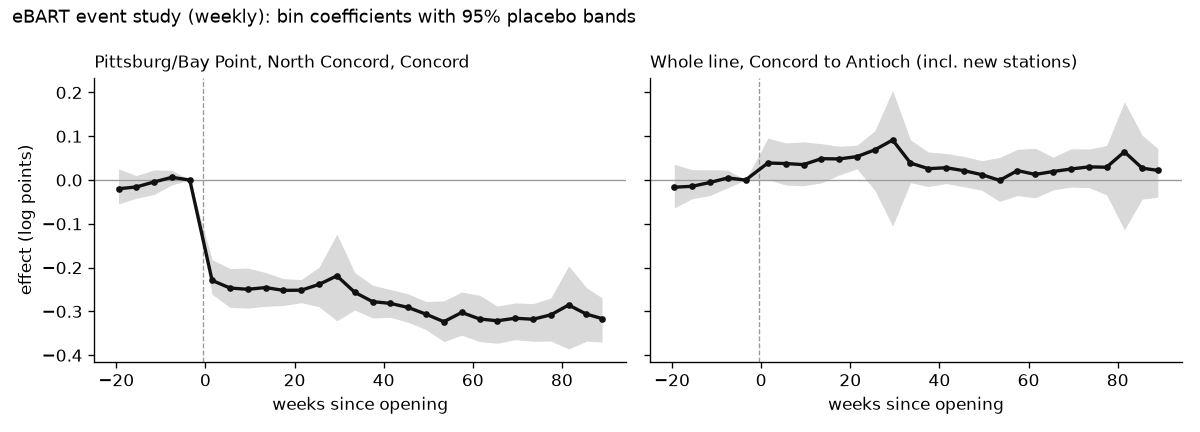
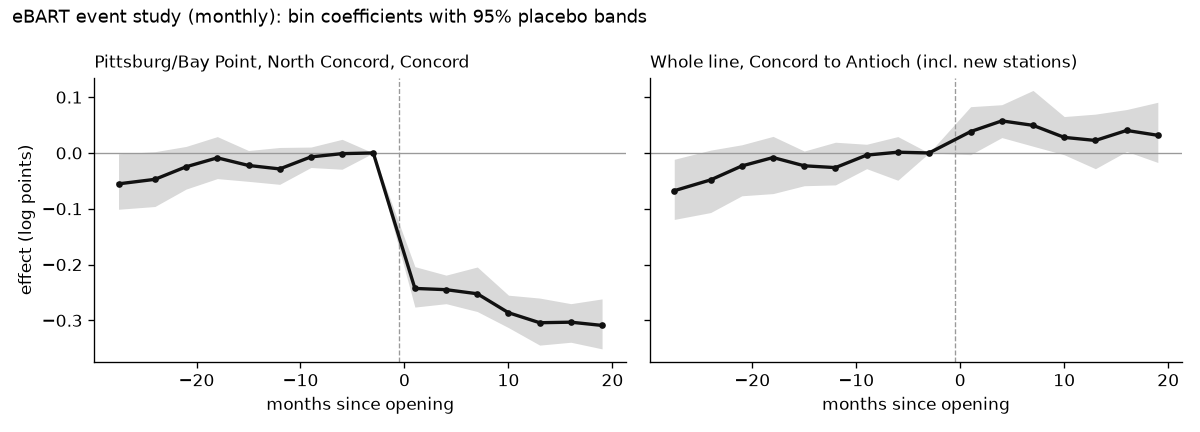
Ran a pre-registered difference-in-differences study of the 2018 eBART extension against 34 control stations with placebo inference validated on synthetic data: the line gained about +4.2% while the three old stations lost 23.9%, and a post-hoc trend check says the gain may be trend.
- 05
Analysed the 15 BART stations named for possible closure with four stated ridership rules, checked the press's claims against the warehouse, and let visitors close them on the live map.
Not built: the Looker Studio and Power BI reports (a build guide, DAX measures and a check week are ready) and a QLoRA text-to-SQL fine-tune, deferred. The live agent runs Gemini, which hasn't been scored on the full eval set; the 50% is a local Llama 3.1 8B.
Data platform02
Cleaning, with a reason for every dropped row
The Spark job reads the headerless BART files with an explicit schema and permissive corrupt-record handling, then tags each row as kept or dropped for one reason: malformed, bad date or hour, bad station code, non-positive trips, or a duplicate (the latest source file wins). Kept rows get weekday and US-holiday flags and are written as Parquet partitioned by year and month, replacing only the months present, with an audit of rows in, rows out and drops per reason. Bay Wheels arrives as irregularly named monthly zips in two schemas (Ford GoBike and Lyft); a DuckDB step normalises both into one, with its own drop reasons (bad timestamps, trips over 24 hours, coordinates outside the Bay Area, trips outside their file's month). Raw files are never edited; downloads are skipped when ETag and size match a manifest.
One definition per number
Every KPI (recovery vs 2019, rolling 28-day entries, year-over-year change, peak-hour share, busiest station) is computed once in a dbt mart, and the site and the agent read those columns instead of re-deriving them. Recovery compares each service weekday with the same ISO week of ISO year 2019, paired with its ISO year, so the turn of the year never compares January with December. The hourly fact is incremental: it re-processes the last 35 days plus any date not yet loaded, so a back-filled year is picked up. A singular test checks that every staged trip date reaches it, and the station dimension is an SCD2 snapshot, so renames and openings are tracked over time.
| 2019 | 2025 | |
|---|---|---|
| Average daily BART entries | 324,958 | 149,335 |
| Service-weekday recovery vs 2019 | 1.00 | 0.43 |
| Bay Wheels trips | 2,506,867 | 4,395,116 |
| Bikes per 1,000 BART entries | 21.1 | 80.6 |
Bikes recovered where trains didn't: in 2025 Bay Wheels ran at 127–210% of its 2019 monthly level, BART at 43–48%. The busiest station on most 2025 days was Embarcadero, and the busiest weekday hour at the top five stations is 5 PM.
Orchestration on a shared free VM
Station forecasts03
One global LightGBM model per quantile (p10, p50, p90) forecasts every station from 1 to 14 days ahead. Each training row is a station, a forecast origin and a horizon, and every feature uses only data up to the origin: the last value, the previous day and 7-day mean, the seasonal-naive value and the last four same weekdays, 28-day volatility, the horizon, the target's weekday, month and holiday flags, and the station itself. Values are scaled by each station's 28-day level, so one model fits Embarcadero and the quietest suburban stop alike.
Calibrating the error band
The band is calibrated with rolling split-conformal prediction on conformalised quantile scores: each test fold widens the p10–p90 band using only the folds before it, so a fold never calibrates itself. It held the actual value on 73% of back-test days against an 80% target (raw p10–p90: 70.5%; the Christmas fold alone is 44%). So the site calls it the "calibrated model range", never the "80% range", and its source line says the band is narrower than it should be. That wording is chosen by the API from the run's own coverage numbers, and the label switches to "80% range" only when a back-test earns it.
Every retrain appends a row to a run log: MAE, RMSE, coverage, each with its CI, plus per-fold metrics.
Causal study: eBART04
Did the 2018 eBART extension to Antioch bring new riders to BART, or just move existing ones to the new stations?
A rider who used to drive to Pittsburg/Bay Point and now boards at Antioch leaves the corridor total unchanged; a rider new to BART raises it. So the study measures both the three old stations and the whole Concord → Antioch line summed into one unit, against 34 BART stations far from the line, with station and week fixed effects on log weekly entries.
| Estimate | Effect | 95% placebo interval |
|---|---|---|
| Whole line, Concord → Antioch | +4.2% (about 505 entries / day) | +1.6% to +7.1% |
| Pittsburg/Bay Point, North Concord, Concord | −23.9% | −25.8% to −21.8% |
| Per station: Pittsburg/Bay Point · North Concord · Concord | −40.1% · −23.1% · −4.3% | each excludes 0 |
| Rest of the yellow line (spillover check) | +0.5% | −1.7% to +3.0% |
| Whole line, net of the pre-opening trend (post-hoc) | +1.0% | −2.4% to +4.2% |
Pre-registered before any result was seen
So eBART brought new riders?
By the rule fixed in advance, yes: +4.2% with an interval above zero. But a quarter of the old stations' riders just moved.
And that upward drift before the opening?
Carry it forward and the gain is about +1% with an interval containing zero. The verdict stays, because the rule came first; the write-up says both.
Reported honestly: the gain is largest in the first year and fades to +1–3% after; the trend-adjusted estimate was chosen after the results and is labelled post-hoc; there are only 3 treated stations; the daily files begin in 2018, so the weekly pre-period is 20 weeks; and the window stops in February 2020. Cluster-robust intervals are reported too, but with 3 treated clusters they under-cover on synthetic data (0.79–0.83), so the placebo intervals are the headline.
Ask BayRidership: a guarded text-to-SQL agent05
Ask BayRidership is a LangGraph graph: a router (keyword pre-filters for data-changing requests, prompt injection and secrets; plain data questions skip the model), SQL generation against a schema card of the mart tables with 5 retrieved example queries and one repair retry, a forecast tool, and an answer that cites the SQL it ran. The page streams the steps over server-sent events (thinking → SQL → rows → answer), offers "Show SQL" and "Copy SQL", keeps the last five answers across a reload, and refuses off-topic questions with suggestions. It has been live on Gemini since 2026-10-16, with Ollama locally.
Guardrail layers
A/B test: do retrieved examples help?
The design was written down first: the question set and scorer frozen by hash, temperature 0, exact two-sided McNemar's test on the discordant pairs, a paired bootstrap CI over questions, and a three-part decision rule (p < 0.05, B ahead, refusal accuracy ≥ 0.9). Arm A ran, then a power analysis simulated from its accuracy (minimum detectable improvement +14 points at 80% power), and only then arm B.
| Arm A | Arm B | |
|---|---|---|
| Execution accuracy (66 questions) | 18 / 66 = 27% | 33 / 66 = 50% |
| Refusal accuracy (10 off-topic) | 10 / 10 | 10 / 10 |
| Guardrail rejections | 0 | 0 |
| Latency p50 / p95 | 2.46 s / 6.71 s | 1.74 s / 4.71 s |
| Discordant pairs | 5 (A right, B wrong) | 20 (A wrong, B right) |
Decision: ship B. +22.7 points, 95% CI +9.1 to +36.4, McNemar p = 0.004, all three conditions
met, so five examples became the default. B's prompt is 34% longer but not slower, because fewer queries failed. A
--check command recomputes every number in the write-up from the committed summaries and fails if any
differs.
Reported honestly: the pool is the eval set's own questions, so for 8 of the 20 questions B fixed, the top example was a near-twin; the lift for unfamiliar questions will be smaller. The test used a local 8B model, and the live Gemini agent hasn't been scored on the full set. A fine-tuned arm C (QLoRA) is deferred, with the harness ready for it.
Which stations can BART afford to close?06
If the Connect Bay Area measure fails on November 3, 2026, BART's adopted plan allows up to 15 station closures from July 2027. The press named the 15 from a February 2026 staff presentation. What does the ridership say about each one?
The list lives in one dbt seed; three marts compute each station's 2025 service-weekday trips, rank from the fewest, recovery vs 2019, change on 2024, the nearest station that would still be open (haversine, assuming all 15 close) and its top three destinations. Four rules, each a point for keeping the station, are stated in one place in the API and shown on the page as text, so anyone can check a verdict by eye against the rounded numbers it displays.
| Station | Weekday trips | % of 2019 | Nearest open station | Rules met | Case to keep |
|---|---|---|---|---|---|
| Oakland International Airport | 1,085 | 41% | San Leandro, 2.9 mi | none | weak |
| Pittsburg Center | 1,121 | 46% | Concord, 8.2 mi | 3 | strong |
| North Concord / Martinez | 1,382 | 34% | Concord, 2.1 mi | 1 | weak |
| Warm Springs / South Fremont | 2,443 | 28% | Fremont, 4.3 mi | 2 | mixed |
| Castro Valley | 2,549 | 45% | Hayward, 1.6 mi | 2 | mixed |
| West Dublin / Pleasanton | 2,573 | 37% | Hayward, 8.9 mi | 2 | mixed |
| Orinda | 2,761 | 47% | Lafayette, 3.4 mi | 3 | strong |
| South San Francisco | 2,839 | 41% | Daly City, 3.2 mi | 2 | mixed |
| South Hayward | 2,959 | 49% | Hayward, 2.9 mi | 2 | mixed |
| San Bruno | 3,114 | 43% | SFO Airport, 2.0 mi | 3 | strong |
| Colma | 3,340 | 38% | Daly City, 1.5 mi | 2 | mixed |
| Antioch | 3,704 | 61% | Concord, 13.6 mi | 4 | strong |
| Millbrae | 3,830 | 31% | SFO Airport, 1.1 mi | 2 | mixed |
| Pittsburg / Bay Point | 4,572 | 58% | Concord, 5.6 mi | 4 | strong |
| Dublin / Pleasanton | 6,240 | 38% | Union City, 10.0 mi | 3 | strong |
Case to keep: strong 6, mixed 7, weak 2. The two stations meeting all four rules are the last two on the Yellow line's eastern end, Antioch and Pittsburg/Bay Point: busier than the bottom 10, recovering better than BART overall, growing, and 13.6 and 5.6 miles from Concord once the whole segment closes. Fourteen of the 15 carried more trips in 2025 than in 2024; the airport station is the exception.
Checking the press against the warehouse
- 01
"The 10 lowest-ridership stations." 9 of the first 10 are among the 10 least-used in 2025. San Bruno is 12th from the bottom, and Milpitas, 5th, isn't on the list. The write-up doesn't guess why.
- 02
"About 12% of ridership." 12.6% of 2025 service-weekday trips start or end at the first 10 (a trip between two listed stations counts once); 24.1% at all 15, about 42,500 trips a day.
- 03
"South San Francisco, 1,538 weekday riders." The warehouse's 2025 average is 1,409 exits, a ratio of 0.92 to BART's January 2026 figure, inside the range set in advance for revisiting the measure.
What the data can't see, and the page says so: what each station costs to run, who rides it, parking and bus links, Caltrain transfers at Millbrae, whether riders would switch or stop riding, and how SFO would be served (it isn't on the list, so it counts as open, which alone decides San Bruno's and Millbrae's Distance rule; the write-up shows both outcomes). Close calls at a rounding edge are reported, not moved. The page takes no position on the measure, cites 13 sources, and will need revisiting after the vote.
The website07
How the map draws every train from the timetable
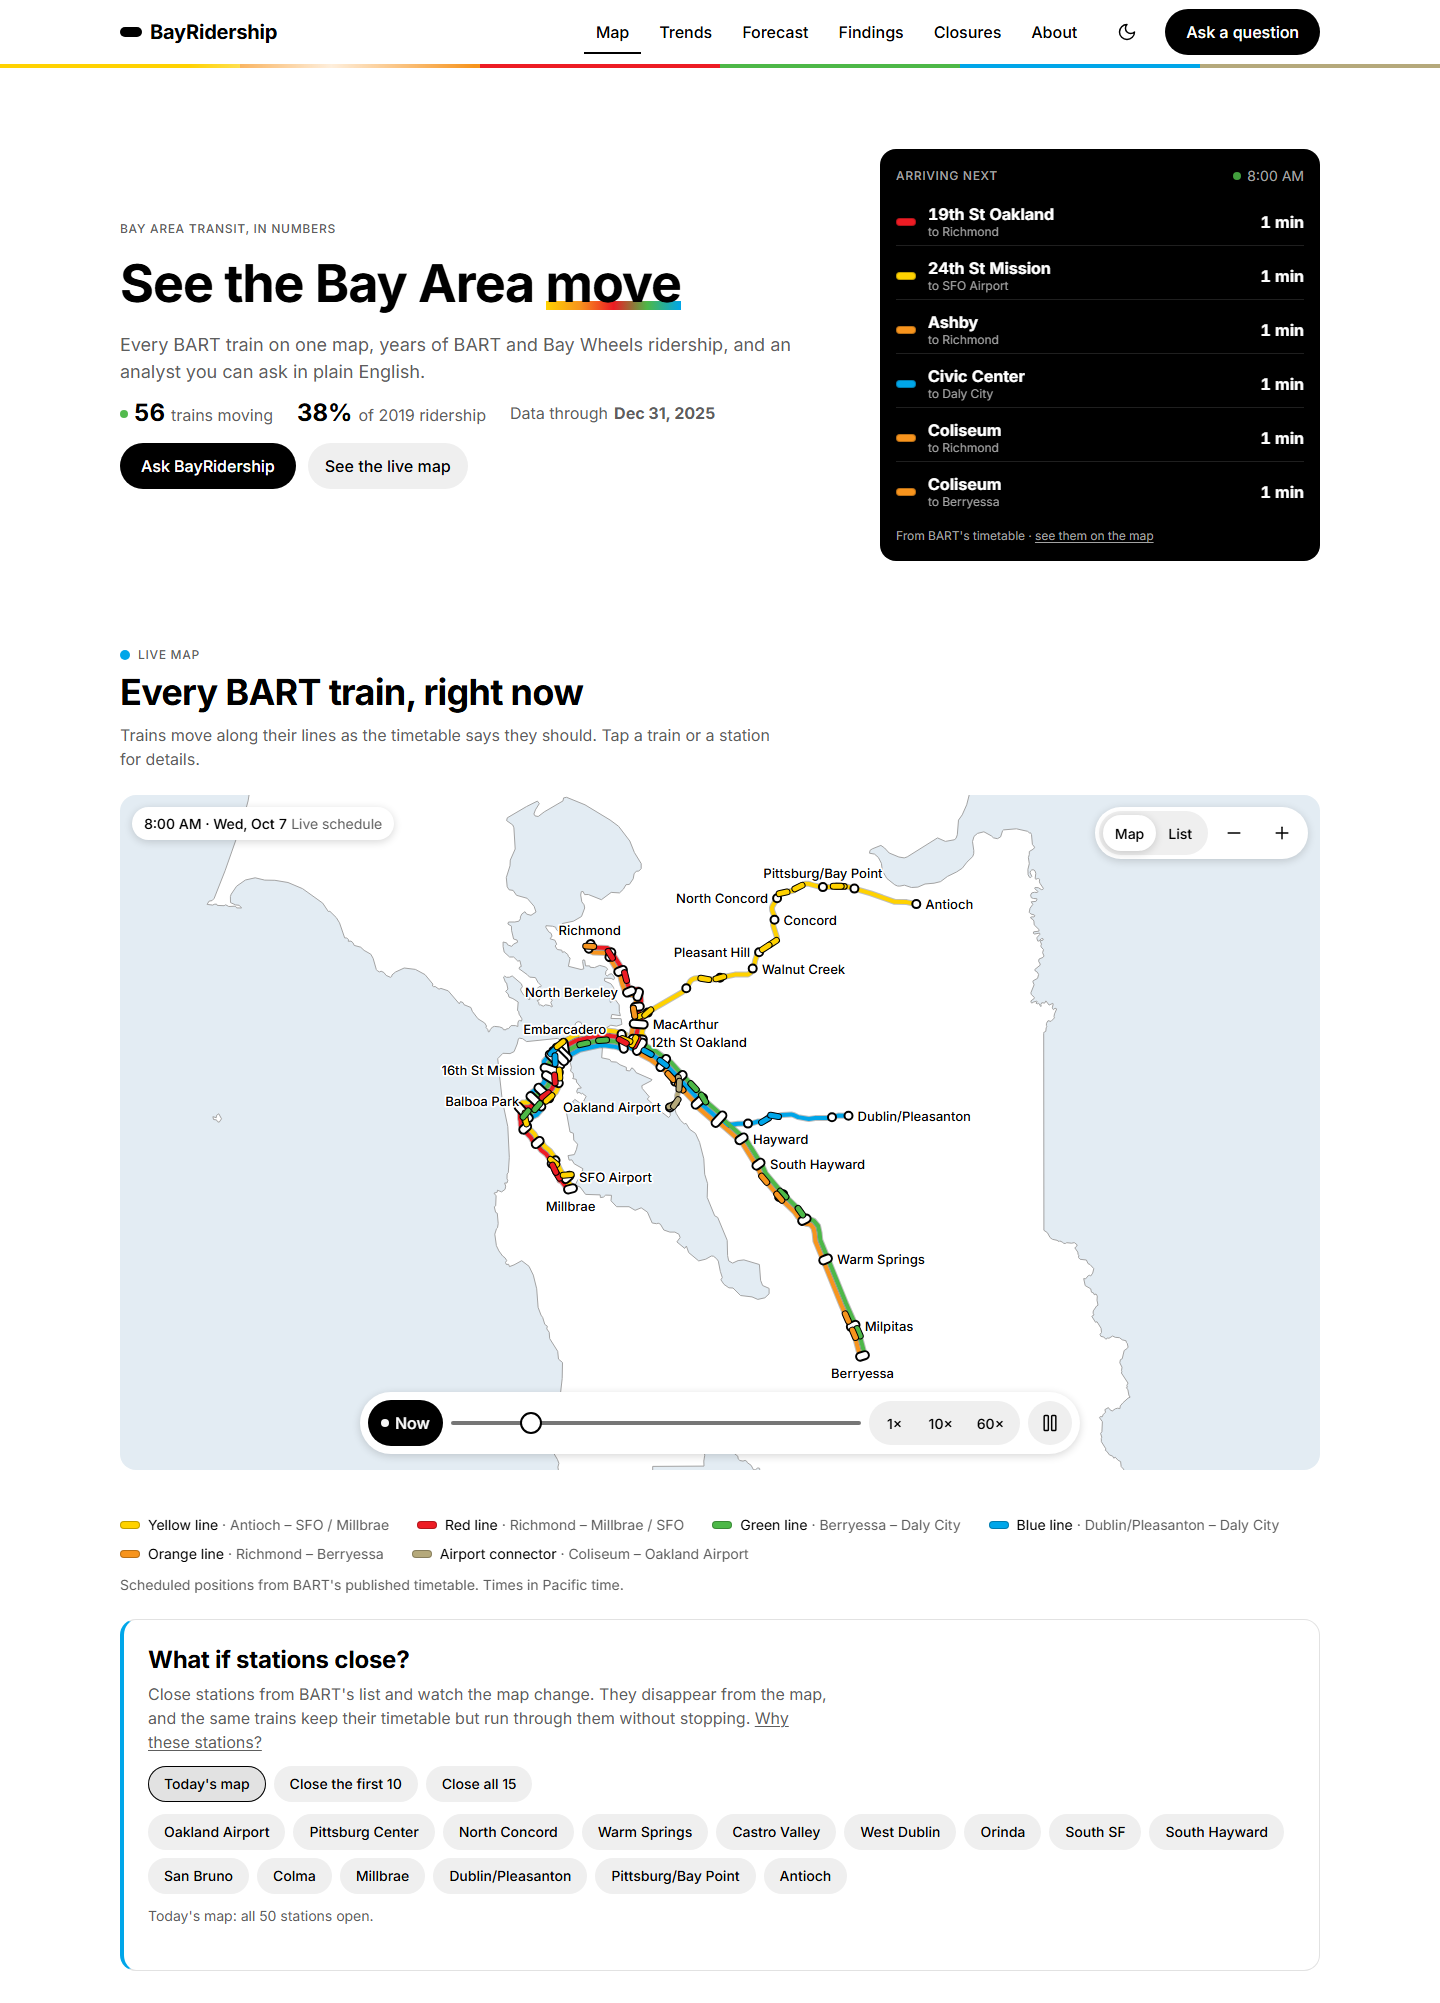
The map needs no API. A build step turns BART's GTFS feed into 88 KB of JSON: 50 stations, 51 track edges with their lines in lane order, 11 service calendars, 34 stop patterns and 3,762 trips in minutes. For the current Pacific time the browser picks the services running that day (weekday rules plus holiday exceptions, including the previous day's after-midnight trips) and interpolates each trip between its departure and next arrival, dwelling at stations. Shared track is drawn as parallel lanes; trains are canvas pills in their line's lane; labels are placed greedily and dropped when they would collide. There is a Now button, a time scrubber, 10× and 60× replay, a list view, a legend that filters lines, and tapping a station loads its forecast without scrolling. Positions are scheduled, not live, and the page says so.
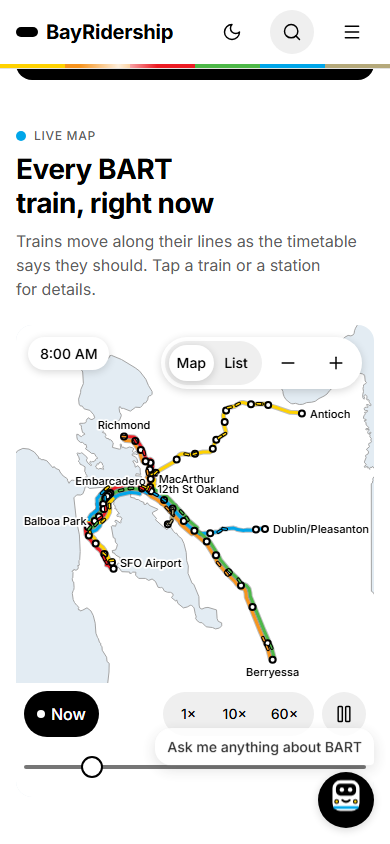
The site is vanilla ES modules with no framework, design tokens that mirror a versioned design document, and a style guide page that renders every token and component in both themes. axe finds 0 contrast violations in light and dark mode at 390 and 1440 px; Lighthouse mobile scores 98 / 100 / 100 (performance / accessibility / best practices, LCP 2.3 s, CLS 0). Reduced-motion users get positions every 30 s with no animation; a polite live region announces the train count once a minute; every control is 44 px on touch.
Shipping08
Everything in GCP is Terraform: BigQuery datasets, the GCS bucket, Artifact Registry, Cloud Run,
the service accounts and their least-privilege roles, the Workload Identity pool, and $1 and $5 budget alerts as
code. The agent's Gemini key lives in Secret Manager and reaches the service only when the agent is enabled. CI is
the only thing that can deploy: no service-account keys in GitHub, and the OIDC condition accepts only this repository
on main.
| Users | Requests / s | Forecast p95 | KPIs p95 | Ask p95 |
|---|---|---|---|---|
| 1 | 1.2 | 62 ms | 540 ms | 870 ms |
| 10 | 11.8 | 8 ms | 11 ms | 58 ms |
| 25 | 29.7 | 14 ms | 22 ms | 140 ms |
Locust against the API on this PC with a fixture warehouse and the LLM mocked (so it measures the code, not Gemini): 0 failures, and the 1-user p95s are the cold cache. On Cloud Run the first request after scaling to zero takes about 4.4 s to the first byte and warm requests 0.09–0.17 s; the map shows immediately because it needs no API. Tests: 179 pytest, 52 node and 75 Playwright tests (axe contrast in both themes), 84 dbt data tests, container smoke tests, a compose smoke test, and reproducibility checks that recompute the A/B, the causal study and the trend adjustment from committed inputs. Expected cost: $0.
make up starts the site, the API and the agent on an Ollama container with one command.