Overview01
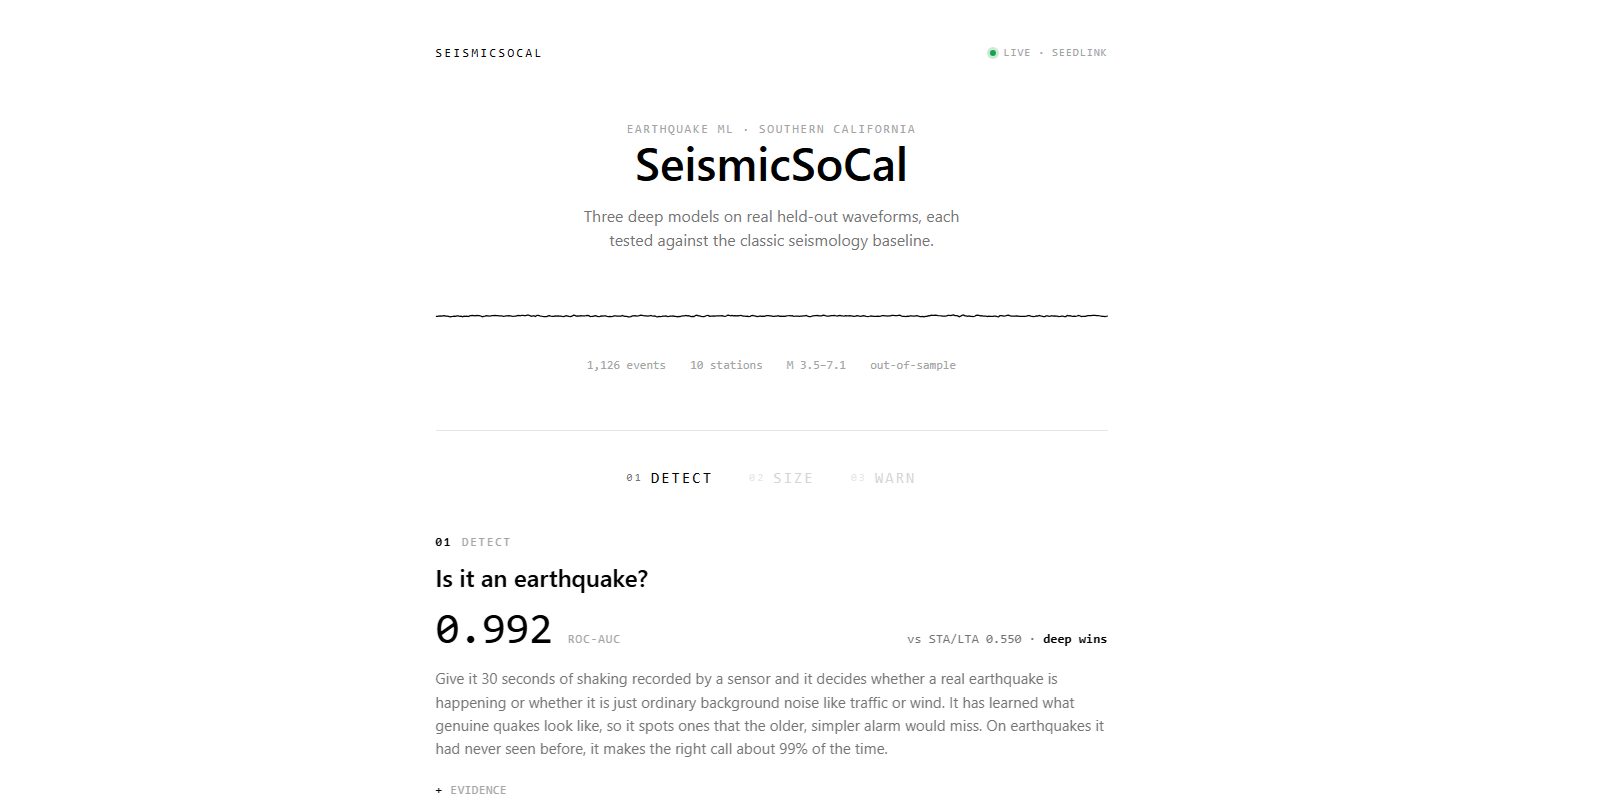
Detect → Size → Warn. Each step is a model, each is compared with the classic seismology baseline on held-out real waveforms, and the whole chain runs live, 24/7, on a free cloud VM.
SeismicSoCal trains on 5,800+ multi-station SCEDC waveform windows and 1,126 magnitude events from 2000–2025. Every split is chronological (70/15/15 by event time), because a random split leaks the future into training. A daemon streams 10 SoCal stations over SeedLink, runs detection continuously, confirms events across stations, sizes them, and sends Firebase push alerts to the Android app.
Scope: this is a research prototype, not an official warning system. It does detection, characterization and rapid shaking estimation. It does not predict earthquakes, because short-term prediction is an unsolved problem.
Results vs. classical seismology02
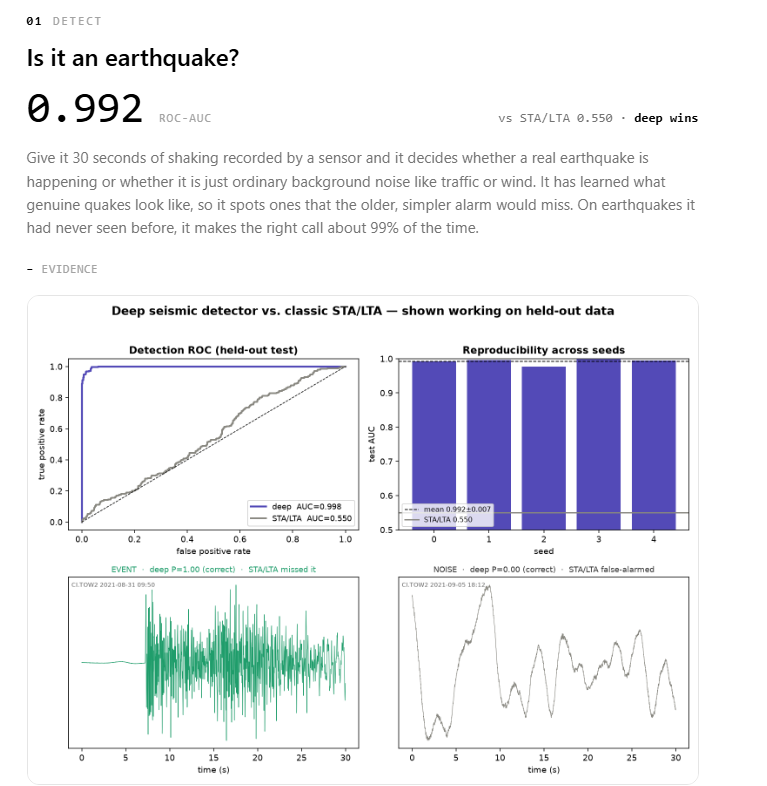
Deep models beat every classical baseline. Detection: 0.992 vs 0.550.
| Task | Architecture | Deep model | Baseline |
|---|---|---|---|
| Detect: is it a quake? | CNN → Transformer, single station | AUC 0.992, MCC 0.930 | STA/LTA 0.550 |
| Size: how big? | CNN → GNN → Transformer, multi-station | R² 0.840, MAE 0.12 | amp + distance 0.749 |
| Warn: how hard will it shake? | CNN → GNN → Transformer on first ~8 s | MCC 0.760, recall 0.76 @ precision 0.82 | GMPE-style 0.655 |
Why MCC and AUC, not accuracy
Earthquake windows are rare, so an "always no" detector looks very accurate. I report ROC-AUC and MCC for detection, R²/MAE against a physics baseline for magnitude, and MCC rather than recall for alerts. Recall is easy to game once you can move the threshold. The baseline reaches similar recall only by false-alarming about twice as often.
STA/LTA scored 0.550. Isn't that basically a coin flip?
Pretty much. The deep detector hit 0.992 on the same held-out windows.
And that's on quakes it had never seen?
Yes, a chronological split, so it never trained on the future.
Detect, in plain English
Give it 30 seconds of shaking recorded by a sensor and it decides whether a real earthquake is happening, or whether it's just ordinary background noise like traffic or wind. It has learned what genuine quakes look like, so it spots ones the older, simpler alarm would miss. On earthquakes it had never seen before, it makes the right call about 99% of the time.
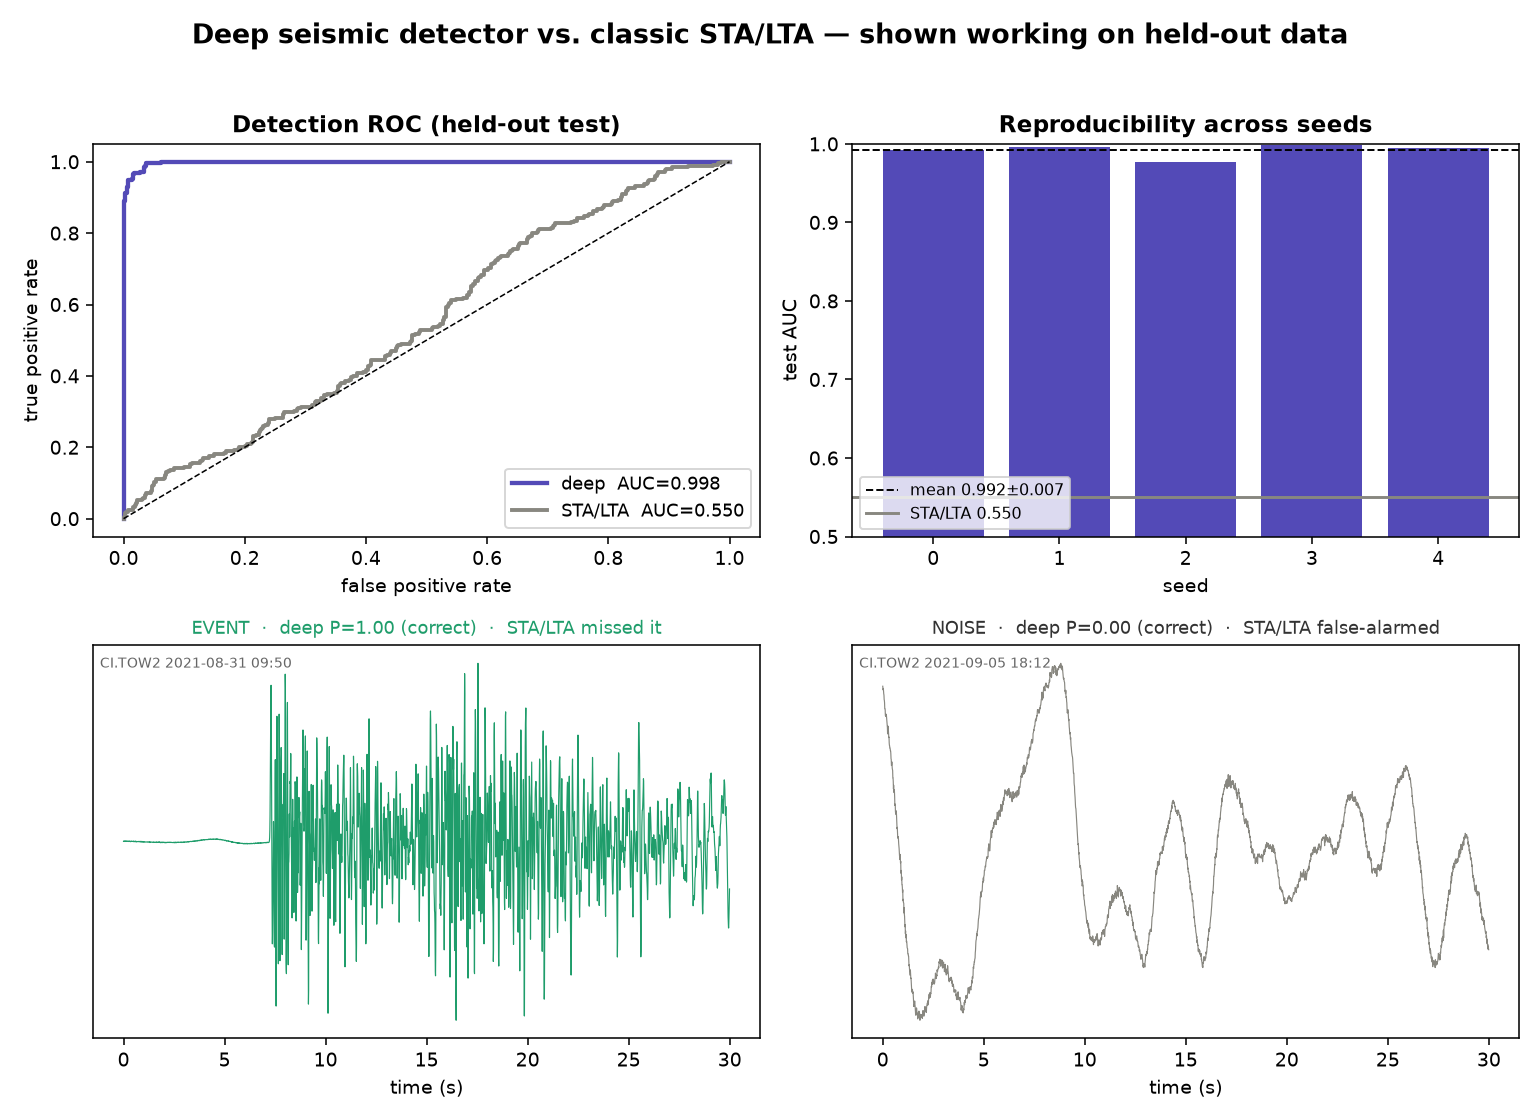
It catches the quake STA/LTA missed and ignores the noise STA/LTA flagged.
Size, technically
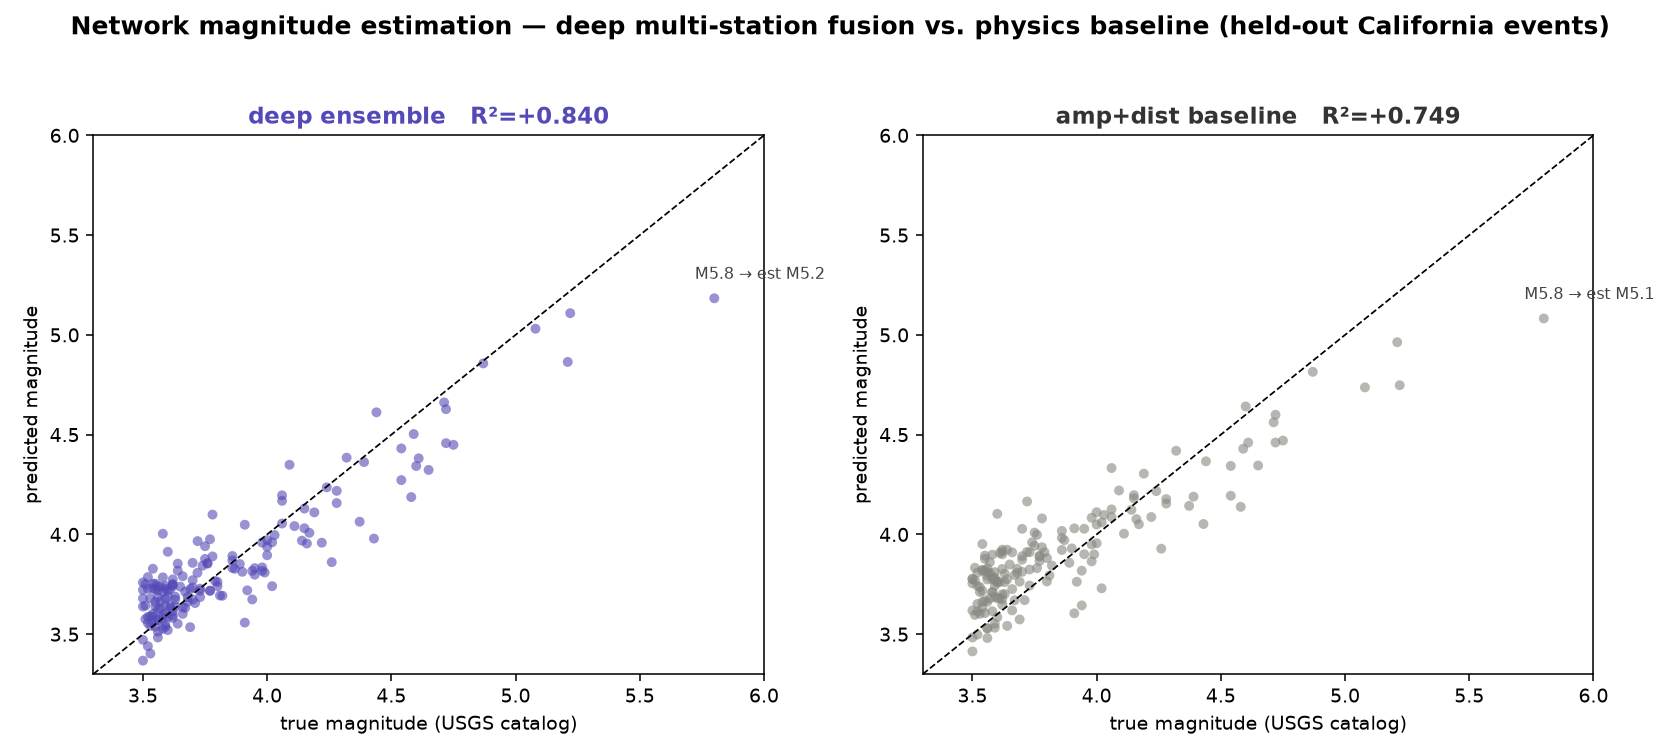
Network-magnitude regression. Per-station 3-component waveforms feed a CNN feature extractor, then a graph convolution across the 10-station network, then a transformer, then a magnitude head. On 1,126 SoCal events (2000–2025), the 5-seed ensemble scores R² = 0.840 (MAE 0.12) against an amplitude + distance linear baseline at R² = 0.749. A nearest-single-station ablation drops to R² +0.42, which isolates the multi-station graph fusion as the source of the skill.
The three models03
All three models share one idea: a 1-D CNN turns raw waveform into local features, and a Transformer encoder reasons over time. Where several stations matter, a graph network fuses them along the real station geometry.
Detect · CNN → Transformer
A 30-second, 100 Hz vertical window (3,000 samples) goes through four strided Conv1d blocks (16→64 channels), then a 2-layer, 4-head Transformer encoder, then mean pooling and a detection head. It learns waveform shape that a threshold-on-energy detector like STA/LTA can't see. Mean AUC across 5 seeds is 0.992 ± 0.007.
Size · CNN → GNN → Transformer
Each station's 3-component trace is embedded by a CNN, tagged with log-distance, and passed through two graph-convolution layers over a normalized adjacency built from station coordinates. A masked Transformer then attends across the stations that actually recorded the event, and a hybrid head adds network amplitude features.
Take away the graph network and R² falls from 0.84 to 0.42.
Warn · early-warning ensemble
The same backbone sees only the first ~8 seconds after the P-wave and predicts the peak ground velocity that arrives later. On the continuous value it ties the physics baseline (R² 0.728 vs 0.720). On the decision that matters, whether shaking will cross a notable threshold, it wins clearly: MCC 0.760 vs 0.655.
Known limits: the magnitude regressor under-predicts the very largest events, and a five-variant fine-tune search (augmentation, cosine LR, Huber, dropout, physics blend) found no reliable gain over 0.840. That points to a real ceiling for this data.
Live detection daemon04
The models run continuously on a live stream. USGS isn't in the loop, so the detector fires on the raw waveforms.
This check is what stops phones buzzing on sensor noise.
Killing false alarms: graded coincidence
- Confirmed: at least 2 stations trigger (p ≥ 0.60) within 12 s, cluster within 150 km of the strongest one, and pass a move-out check. The arrival-time differences must be physically possible given the distance between stations (slowest wave 2 km/s, plus 4 s of pick jitter). Only confirmed events are sized and pushed.
- Tentative: a lone station above a higher 0.85 bar is logged as a possible false alarm but not pushed, because lone live triggers are almost always telemetry noise.
- Two far-apart stations glitching in the same 12-second window are independent noise, not one source. The 150 km coherence check catches what move-out alone can't.
- Every declaration goes to an audit log, and a scheduled job cross-checks it against the official catalog.
Alerts by station, not location
Users subscribe to sensor stations, not coordinates. Signup ranks the 10 stations by distance and auto-selects the nearest 3 within 150 km. Each one can be toggled. No latitude or longitude is stored, only station codes and a push token. A shaking model turns magnitude and distance into the plain-language intensity in the alert text.
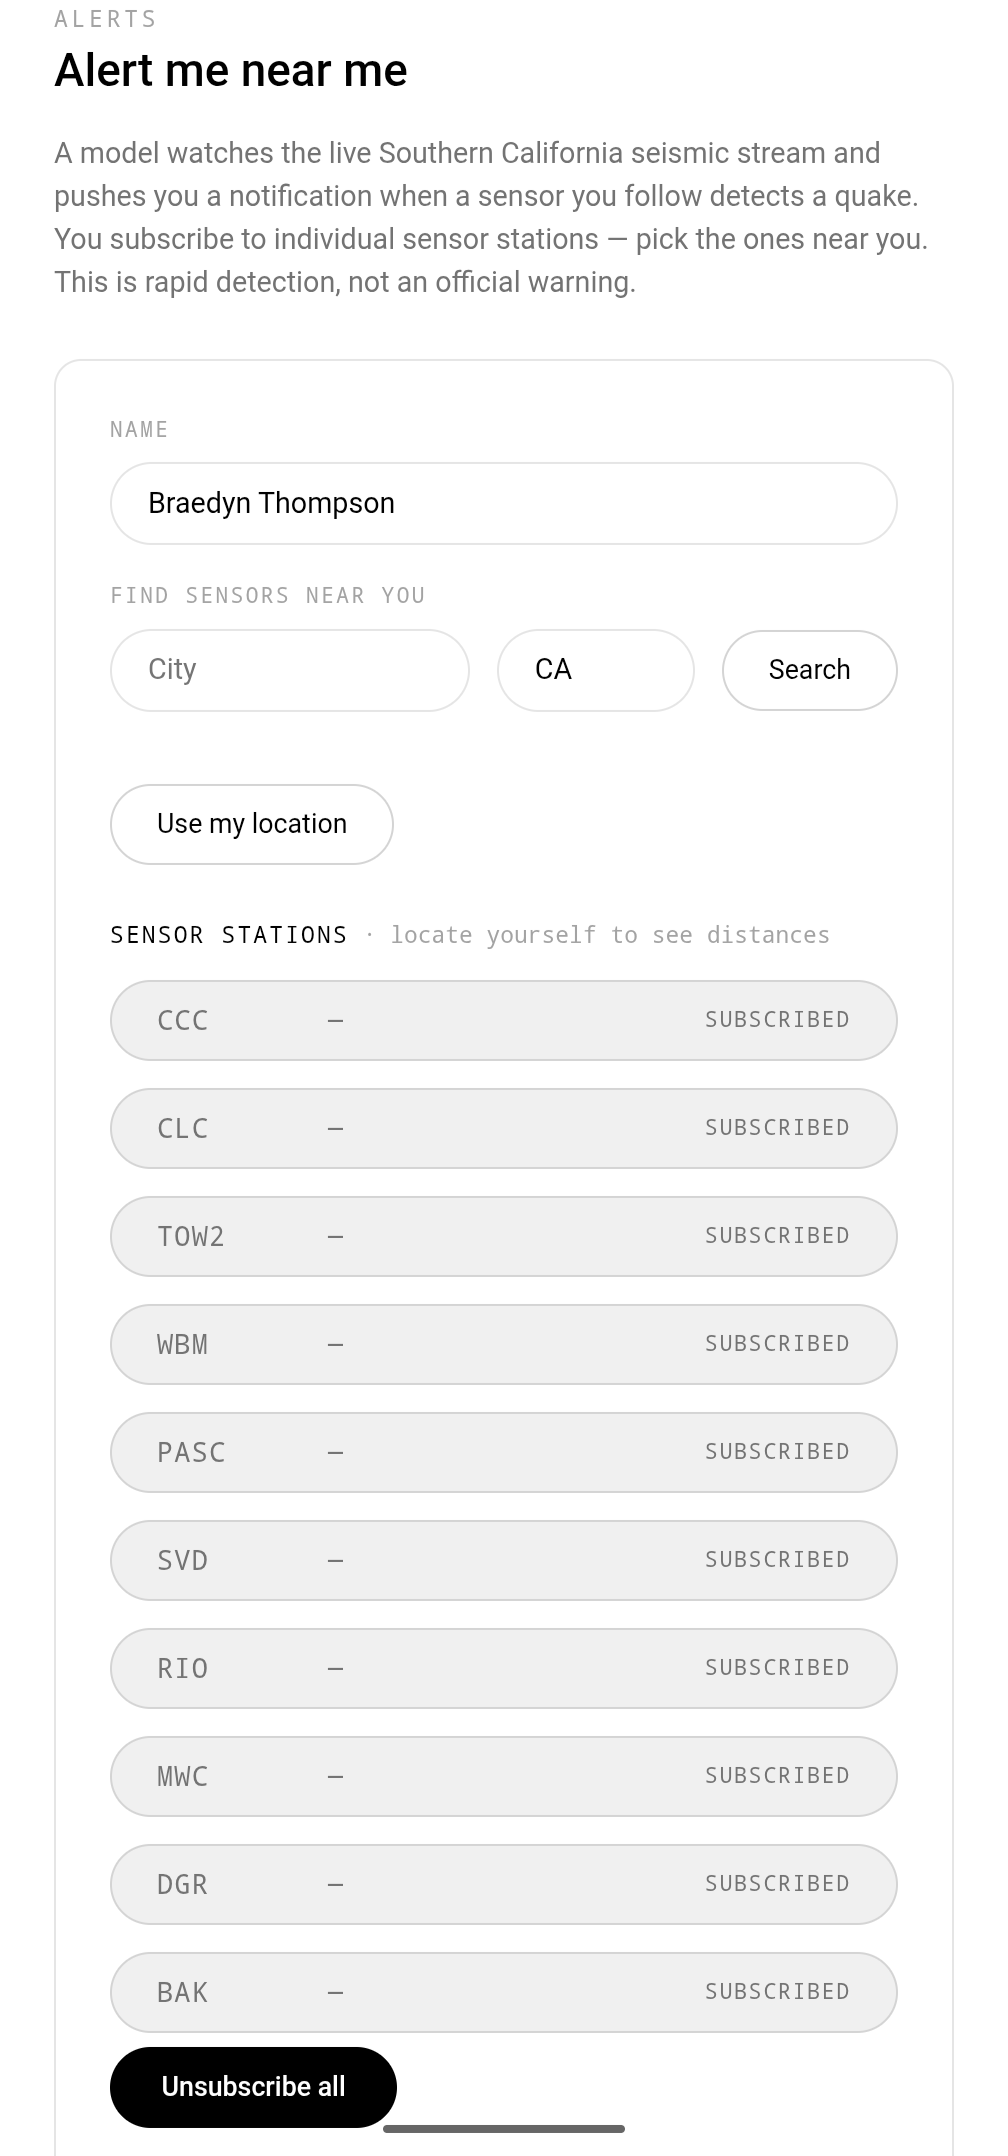
Subscribe to sensors, not a location.
Deployment & architecture05
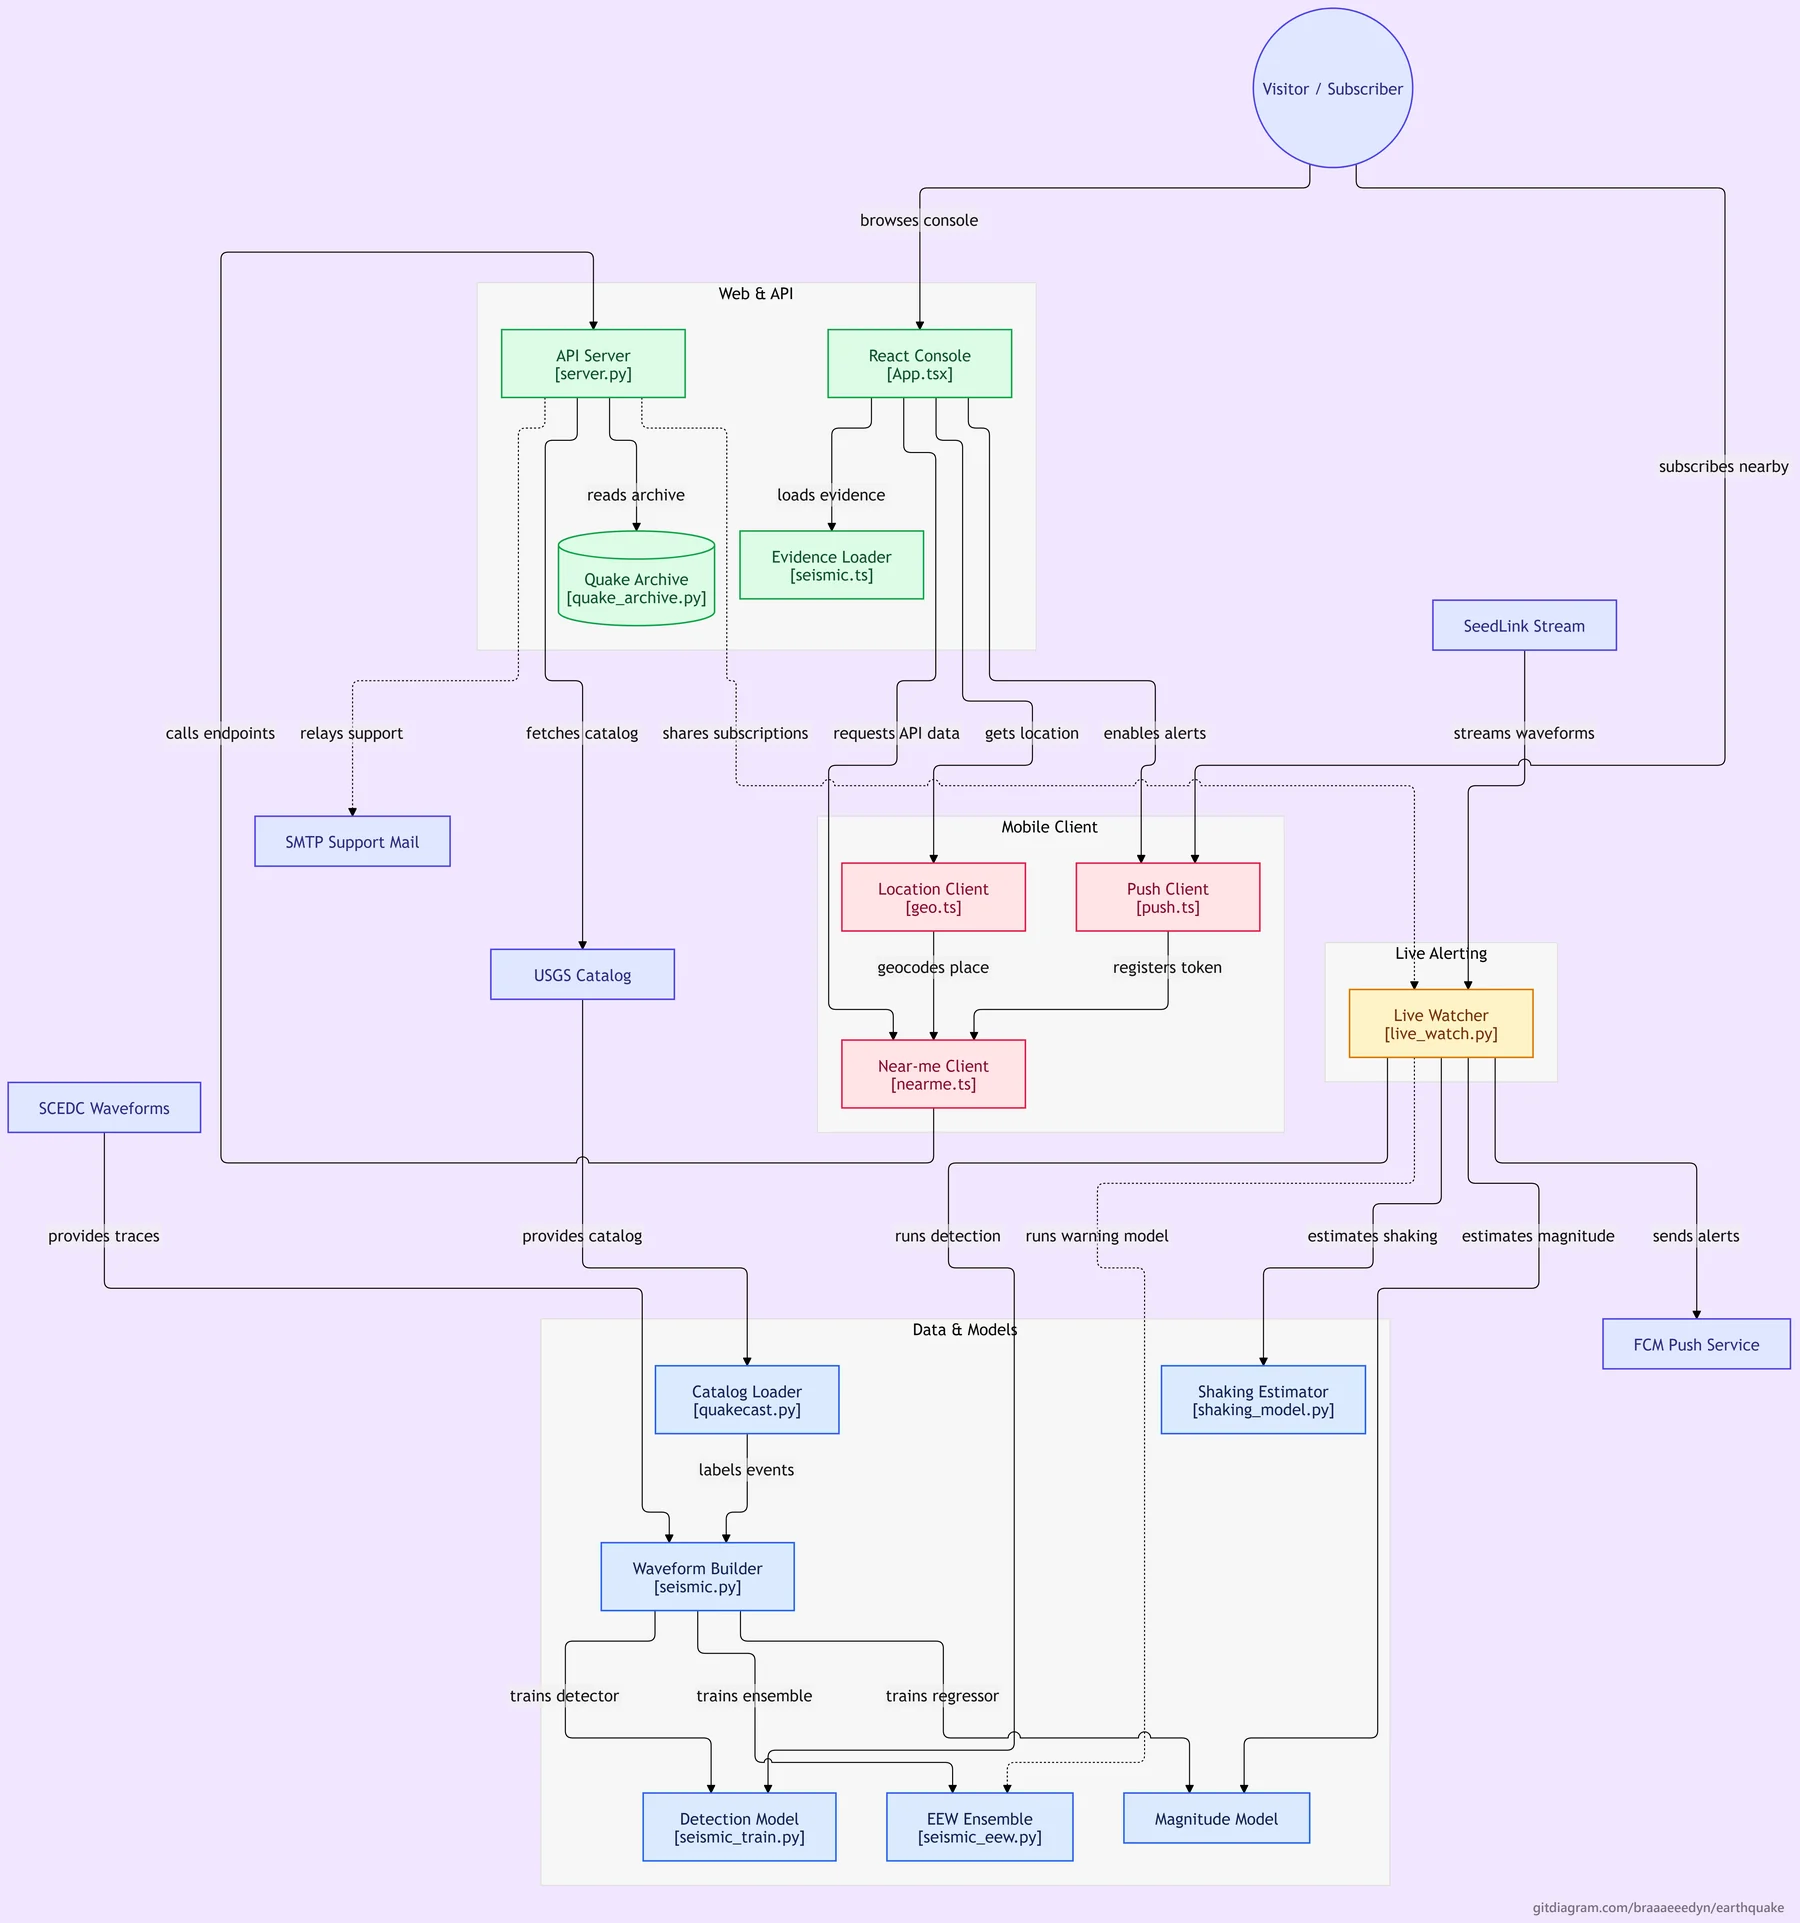
The whole service runs on an Oracle Cloud Always-Free Ampere A1 (ARM64) VM. Caddy provides automatic HTTPS and the static site, and a systemd unit runs the stdlib-Python backend, which auto-spawns the SeedLink daemon and respawns it if the stream drops. A separate systemd timer runs the catalog cross-check.