Overview01
Systemwide tuition is the same at every UC campus, but rent isn't. UC Campus Rent tracks the typical rent in the ZIP codes where students live around eight campuses, forecasts it a year ahead, and asks one causal question: when a campus opens new housing, does rent next door come down?
An Airflow pipeline on a free Oracle VM downloads seven public sources once a month, checks each file with Great Expectations and loads it into Postgres. dbt models the raw tables into a monthly mart per campus and an event-study mart. A LightGBM quantile forecaster retrains when the marts change and is promoted in MLflow only if it passes a gate written down in advance. The results go out as JSON to a hand-built site that is live on this domain, as an Excel workbook per campus, and to BigQuery.
- 01
Built a monthly Airflow pipeline over seven public sources (Zillow, HUD, the Census Bureau, California HCD, Apartment List and IPEDS) into Postgres: a Great Expectations suite per source that quarantines a failing file, a manifest of every file loaded, and 61 dbt tests on the models.
- 02
Defined each campus's ring of student ZIP codes with one stated rule (within 5 km of campus) plus a short, reviewable list of overrides: 50 ZIP codes across 8 campuses.
- 03
Forecast rent 12 months ahead for every ring ZIP code as a p10 / p50 / p90 band with LightGBM, behind a pre-registered gate: a challenger replaces the champion only if its pinball loss on a 24-month backtest is at least 2% lower and its band covers 70 to 90% of the actual values.
- 04
Ran a difference-in-differences and an event study for each campus housing opening against three matched control ZIP codes, with the verdict rules written before any real data was loaded.
- 05
Shipped a public site with a page per campus, keyboard-readable SVG charts and a shared cheer counter, and a read-only check that the live data files match the pipeline's export byte for byte.
Not built yet: the Looker Studio report on the BigQuery copy. The forecast's first scheduled month hasn't completed, so this page quotes no realised forecast error. The code is in a private repository.
Rent near eight campuses02
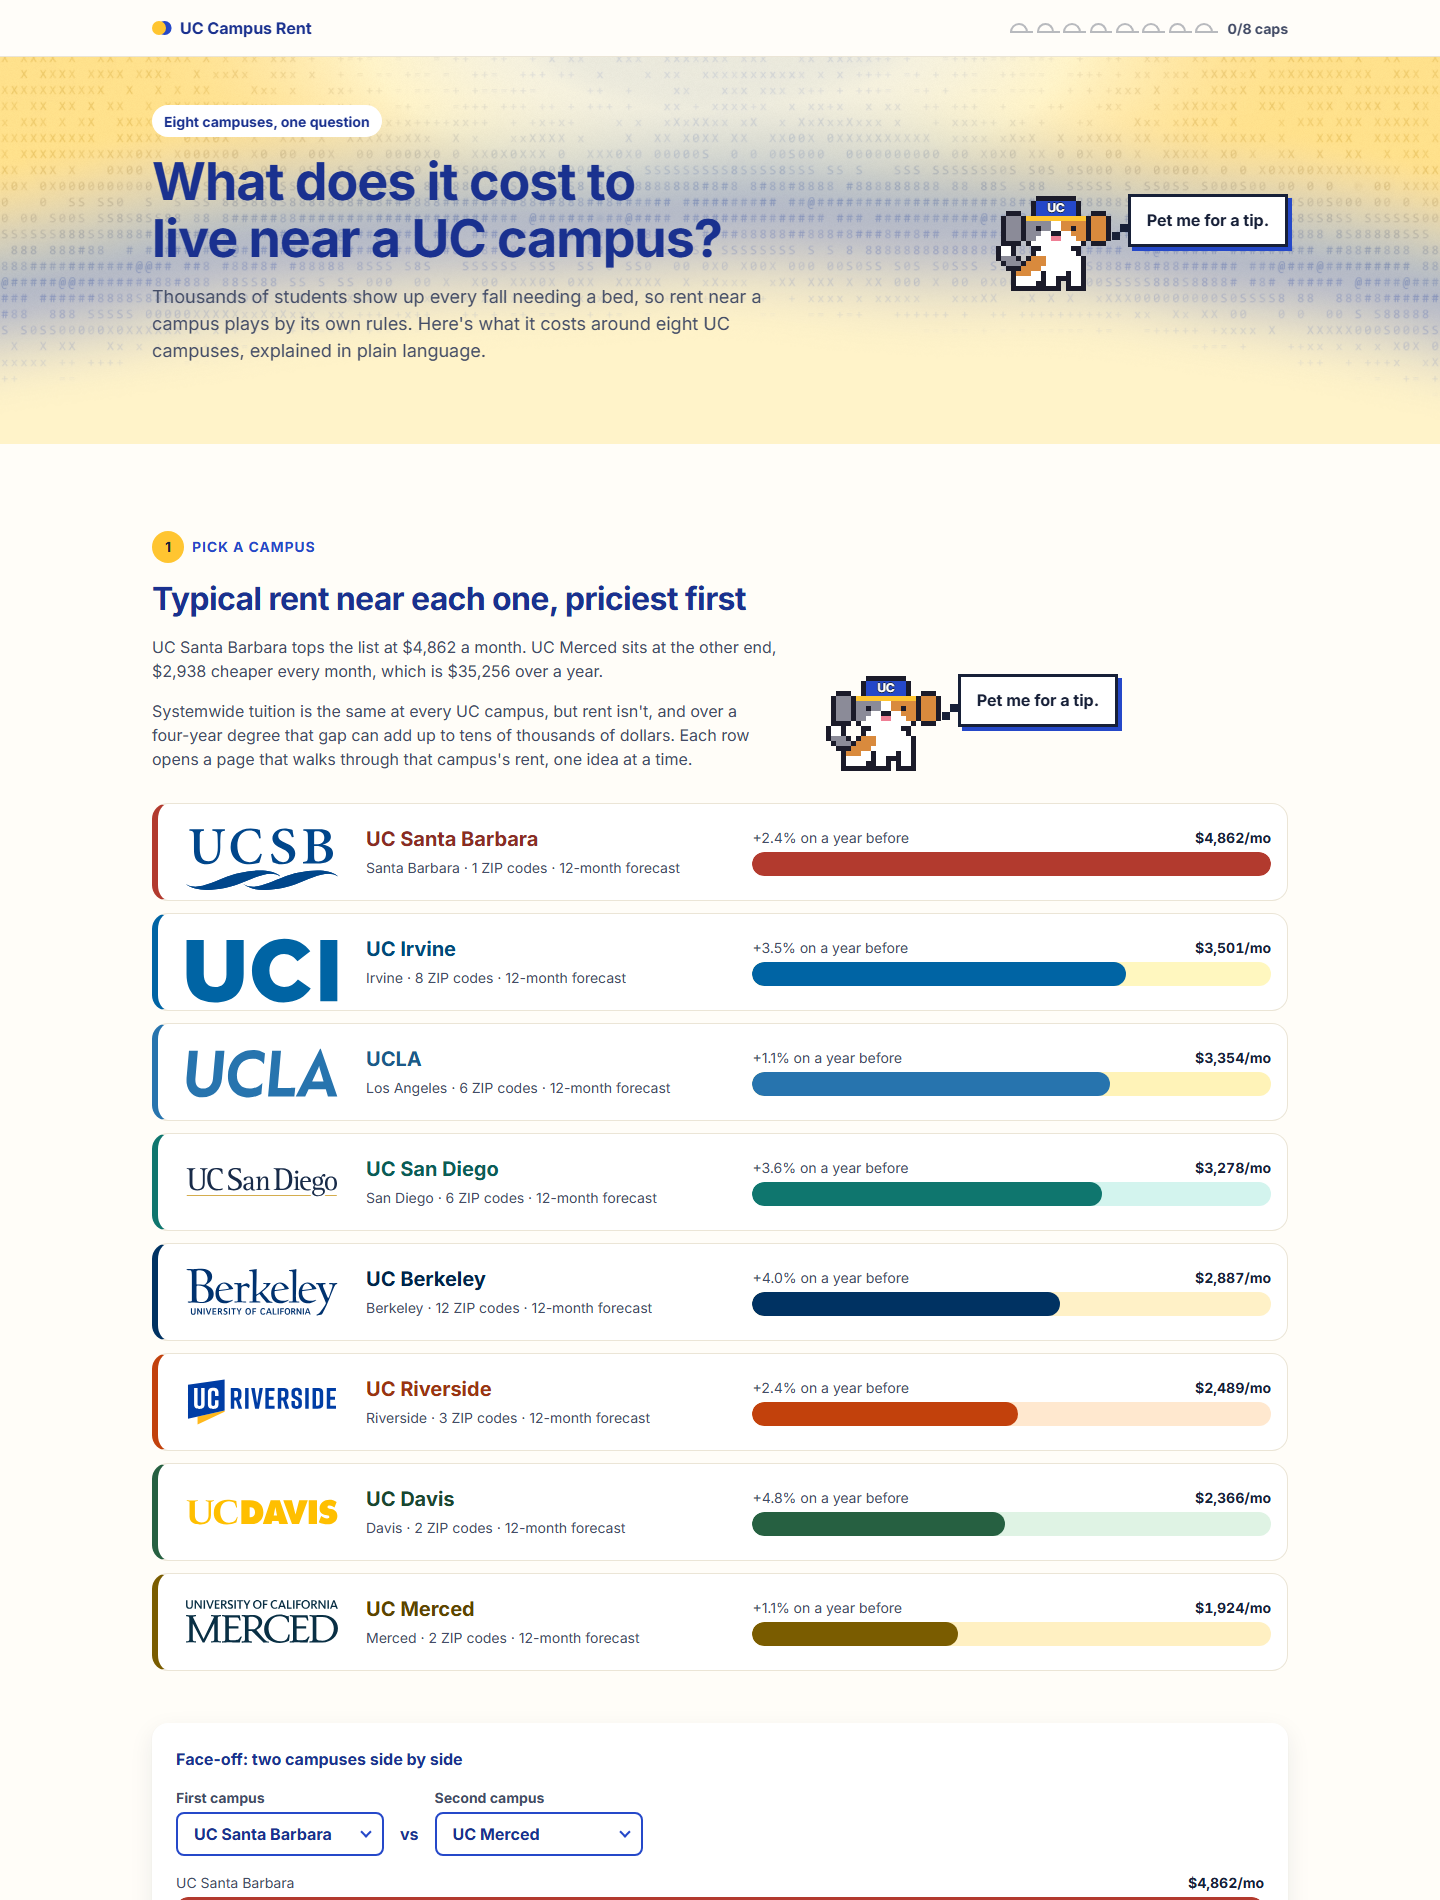
Each campus's number is the median of Zillow's observed rent index across the ZIP codes in its ring that report rent that month. Using the median means one very expensive ZIP code can't pull the figure up the way an average would. The count of reporting ZIP codes is shown with the number everywhere, because some rings are thin.
| Campus | Typical rent | Change in a year | ZIP codes reporting |
|---|---|---|---|
| UC Santa Barbara | $4,862 | +2.4% | 1 |
| UC Irvine | $3,501 | +3.5% | 8 |
| UCLA | $3,354 | +1.1% | 6 |
| UC San Diego | $3,278 | +3.6% | 6 |
| UC Berkeley | $2,887 | +4.0% | 12 |
| UC Riverside | $2,489 | +2.4% | 3 |
| UC Davis | $2,366 | +4.8% | 2 |
| UC Merced | $1,924 | +1.1% | 2 |
How the ring is defined
A script reads the Census Bureau's ZIP-code file and each campus's coordinates and keeps the ZIP codes within 5 km, or the three nearest where a campus has fewer. That rule misses student neighbourhoods a little farther out and includes places where students don't rent, so a seed file of overrides adds and drops ZIP codes one line at a time, each with its reason. The overrides were fixed before the Census data behind the causal study was loaded, and they stay fixed for any campus with a housing opening, so the study's comparison can't be tuned after the fact.
Reported honestly: Santa Barbara's figure rests on one ZIP code and Davis's and Merced's on two each. The site shows that count beside every rent. Data Provided by Zillow Group. This product uses the Census Bureau Data API but is not endorsed or certified by the Census Bureau. The site is not affiliated with the University of California. The city-level sources (permits, completions and Apartment List) cover four of the eight campus cities; the other campus pages hide those parts.
Data platform03
The seven sources
| Source | What it adds |
|---|---|
| Zillow observed rent index and home value index | rent and home values by ZIP code, monthly |
| HUD Small Area Fair Market Rents | the 2-bedroom fair market rent by ZIP code, yearly |
| Census ACS 5-year | income and rent by ZIP code area: rent-to-income, and the match for control ZIP codes |
| Census Building Permits Survey | housing units permitted by city, monthly |
| California HCD Annual Progress Reports | housing completed by city, yearly |
| Apartment List | a second, city-level rent estimate to set beside Zillow's |
| IPEDS | fall enrollment per campus |
Not every source may be downloaded by a script. Where a source's terms rule that out, its DAG reads a file the owner downloaded in a browser instead of fetching it, and the rest of the path is the same. Every credit line a source asks for is part of the published data files, and the check on the published files fails if one is missing.
Assets decide what runs
Each source's load updates an Airflow asset. A load triggers the dbt build; a finished build triggers the forecast and the publish; a promoted model triggers the publish again. So one new Zillow file flows through to the public site with no manual step, and a failing source test stops the marts until a person looks.
A gated forecast04
One LightGBM model per quantile forecasts each ring ZIP code's rent from 1 to 12 months ahead. The target is the log ratio of the future rent to the rent at the forecast origin, so one model fits a $1,900 ZIP code and a $4,800 one alike. The baseline it has to beat is a seasonal naive forecast with drift: the same month last year, scaled by the trailing year's growth.
A gate written before the first real run
The first run on real data passed the gate and became champion version 1: forecasts from September 2026 for the 40 ring ZIP codes that have rent data, 12 months each. After every forecast a monitor compares the newest month's actual rents with what the champion predicted and writes a monthly report on error and data drift.
The gate lives in one Markdown file, and a test checks that the file states exactly what the code applies.
Reported honestly: the site draws the band as a typical ring ZIP code's range and says rent should land inside it "about 8 times in 10". Whether it does is the monitor's job to report once real months accumulate; none are quoted here yet.
Causal study: new campus housing05
When a campus opens a large residence hall, do rents in the surrounding ZIP codes fall?
For each opening the study follows the ring's median rent from 36 months before to 24 months after, against the median of three control ZIP codes in the same metro, matched on Census median gross rent. It works on the log of the ratio between the two, so a shift that hits the whole metro cancels out.
Verdicts fixed in advance
The wording of every possible result was written before any real Census release was loaded. An interval that contains zero reads "no detectable effect" and is shown with its bounds as a bounded null. If the ring and its controls were already drifting apart before the opening, the verdict adds "not a credible causal estimate". The trend-robust estimate can qualify the main verdict but can never turn a null into an effect.
So does new campus housing lower rent next door?
On the first real run, five openings have an estimate and none shows a detectable effect either way.
Is that a no?
It's a bounded null. A hall of one or two thousand beds may move a ZIP-level rent index by less than the index can show, and the write-up says so.
Reported honestly: each opening is one treated series against three controls; the windows of the earliest openings overlap the pandemic; and on very persistent synthetic series the intervals cover the truth less often than 95% of the time, which the write-up quantifies. The opening month and bed count of four openings are still being confirmed against campus sources, so their results are marked provisional on the site and are not quoted here.
The website06
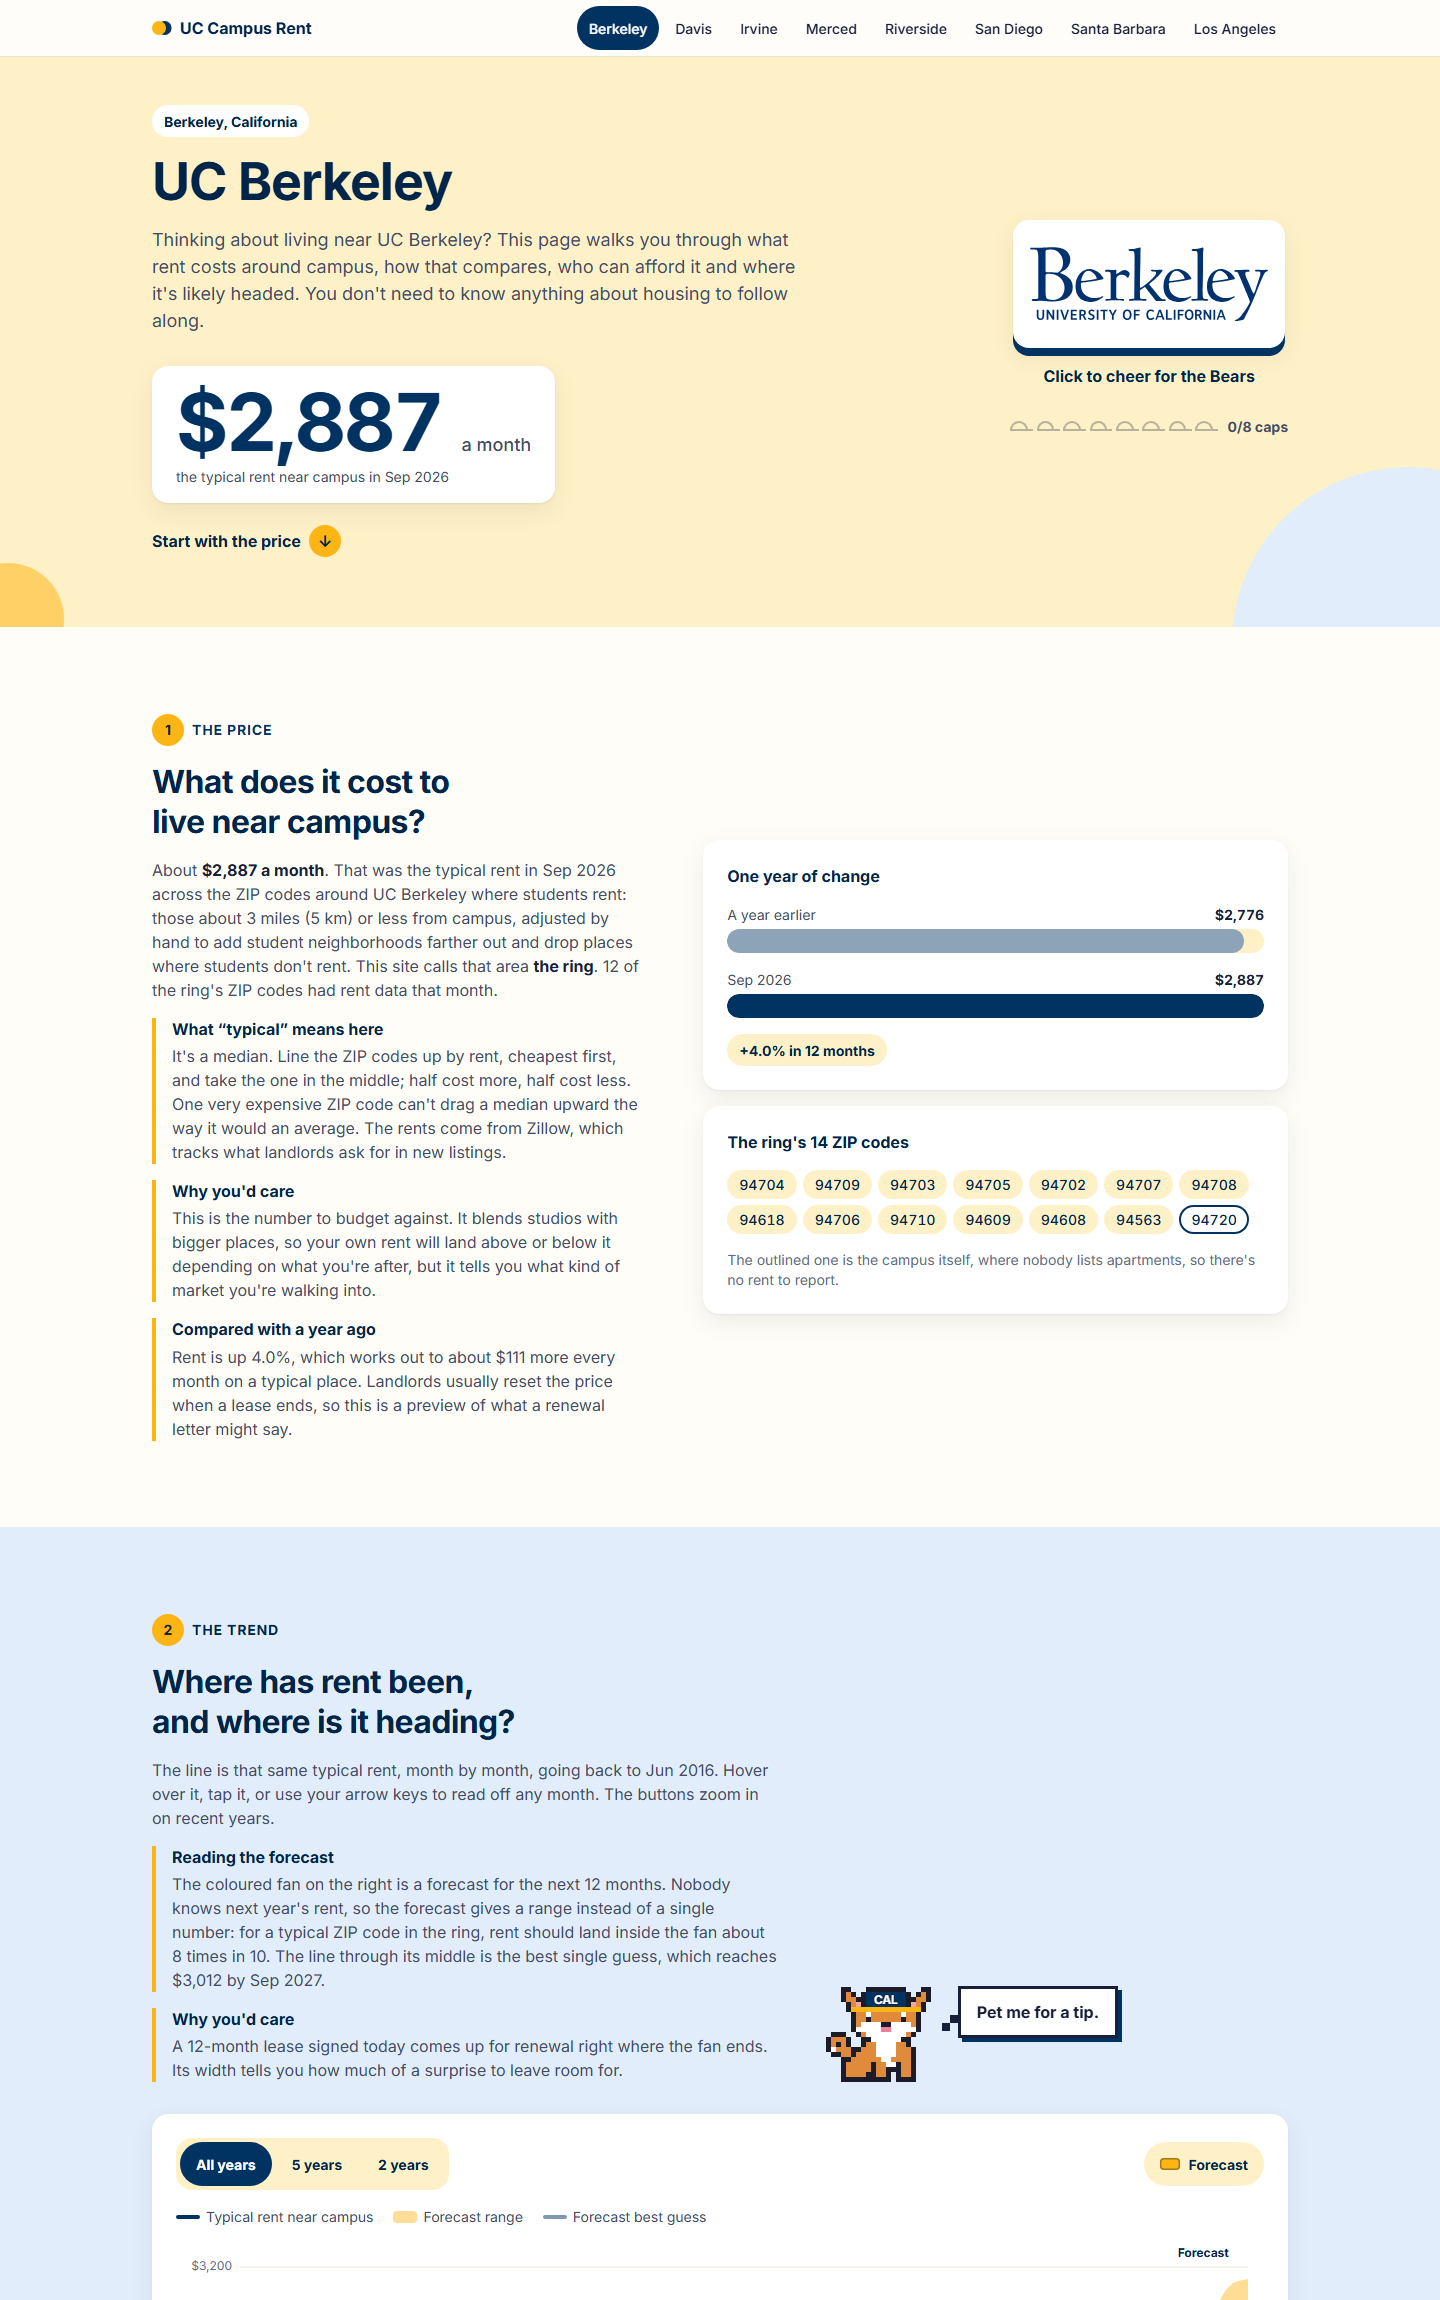
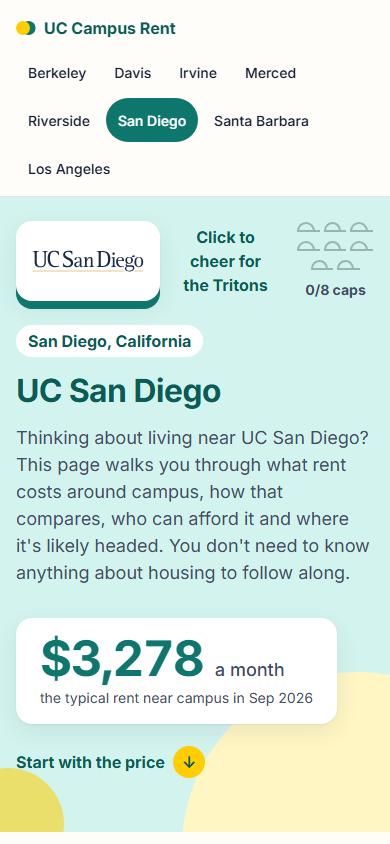
A page per campus, written for someone who has never read a housing report
Each campus page walks through six short chapters, from the price today to the forecast, affordability, supply
and the housing study, each with a plain-language "why you'd care". Every chart is hand-built SVG with a data table
behind it, a readout on hover, tap and the arrow keys, and it redraws to fit any screen from 320 to 2560 px. Each
campus has its own colour theme, and the site is one campus.html that reads a JSON file per campus:
plain HTML, CSS and JavaScript modules, no framework and no build step.
Shipping07
The pipeline shares a free 2-core Oracle VM with BayRidership and SeismicSoCal. Its five services run as systemd units with memory ceilings that sum to 3 GiB and a lower out-of-memory priority than the neighbours, so the earthquake detector always wins. Only the cheer counter is reachable from outside, through the VM's existing Caddy server; everything else listens on localhost and is opened through an SSH tunnel. A read-only health script reports every unit of all three projects, sampled twice a minute apart, without restarting anything.
Everything in Google Cloud is Terraform: the raw-file bucket, the BigQuery dataset for reporting, a service account with no key in GitHub (Workload Identity Federation pinned to the repository) and a $1 budget alert as code. Tests: 278 pytest, 20 DAG tests that run inside the Airflow image, 35 Playwright browser tests and 61 dbt tests, plus the soak run, in which every DAG went green on the first try and the idle stack ran 20 minutes without a restart. Expected cost: $0.
The installer is idempotent: running it again pulls the code, re-syncs the environments and restarts the units.